|
|
Extracts from Ofcom Complaint, by Category: Falsification/Manipulation1. Falsification/Manipulation of Graphs |
|
|
|
|
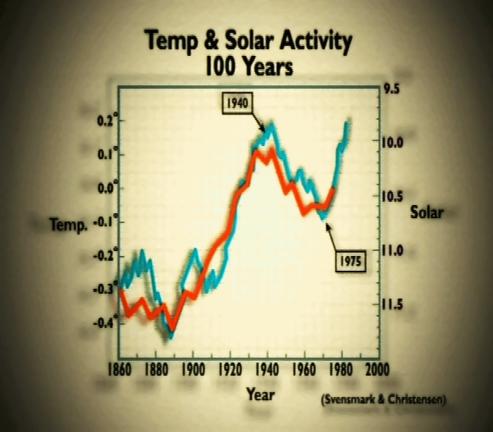
[Comment 59: A graph is shown plotting temperature (blue line) against “solar” (red line): Although the graph is attributed by the Channel 4 programme to “Svensmark and Christensen” it was first published in a paper by Friis-Christensen and Lassen, Science 254, 698 (1991), see http://tinyurl.com/39dyse. The number of sunspots change in a cyclical way over a time period of about 11 years, but this “solar cycle length” varies from cycle to cycle. The documentary reports that Friis-Christensen and Lassen found a good correlation between solar cycle length and temperature. However, the documentary does not mention that after corrections and updates to their original paper the correlation after 1975 disappeared (see for instance Kristjánsson, 2001, http://tinyurl.com/yvc8zu, PDF); with the temperature rapidly increasing while the solar curve remains flat. The solar (red) line in the documentary ends in 1975 before this break-down in the correlation began, presenting a deeply misleading picture. These later corrections in the scientific literature are summarized by Damon and Laut in a paper in EOS, Transactions American Geophysical Union, 2004 (abstract at http://tinyurl.com/2m5jwk, full version at: http://tinyurl.com/q7wg5, PDF). Damon and Laut summarise the findings of a number of peer reviewed papers, which show: Continued … |
[Bookmarks on this page:
Click any of the following links to go to that bookmark. You can then copy and paste
the bookmark’s url from your address bar, and send it to someone as a link
straight to that bookmark:
Comment 59: 20th century Sunspot Activity /
Graph from film: Temp and Solar Activity 100 Years]
|
|
||
