|
|
Extracts from Ofcom Complaint, by Category: Falsification/Manipulation1. Falsification/Manipulation of Graphs |
|
|
|
|
|
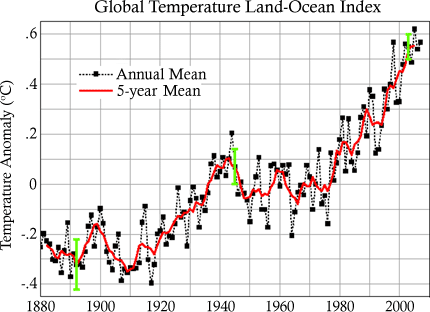
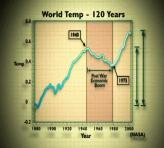
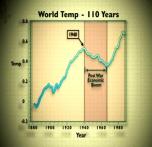
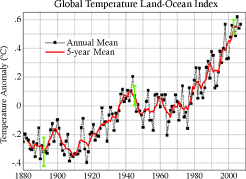
In fact, the real NASA data is readily available on NASA’s own website at http://tinyurl.com/2fq44q and is shown below: The NASA graph directly contradicts the programme’s assertion that “most of the rise … occurred before 1940”. It also shows that the extent of the mid-century cooling is greatly exaggerated in both of the graphs shown in the documentary. Finally, the claim made by the narrator that the temperature fell for four decades is only supported by the earlier, falsified graph, and is contradicted both by the corrected graph and by the NASA data. The conclusions stated in the documentary about temperatures in the 20th century are thus based on incomplete, old and apparently intentionally falsified data, and were used to mislead the public regarding the status of current scientific knowledge. For comparison purposes, here are the three graphs alongside each other:
(In breach of the 2003 Communications Act Section 265, Ofcom 5.4, 5.5, 5.7) |
[Bookmarks on this page:
Click any of the following links to go to that bookmark. You can then copy and paste
the bookmark’s url from your address bar, and send it to someone as a link
straight to that bookmark:
NASA graph of Global Land Ocean Index /
Three graphs comparison]
|
|
||


