|
|
Extracts from Ofcom Complaint, by Category: Falsification/Manipulation1. Falsification/Manipulation of Graphs |
|
|
|
|
|
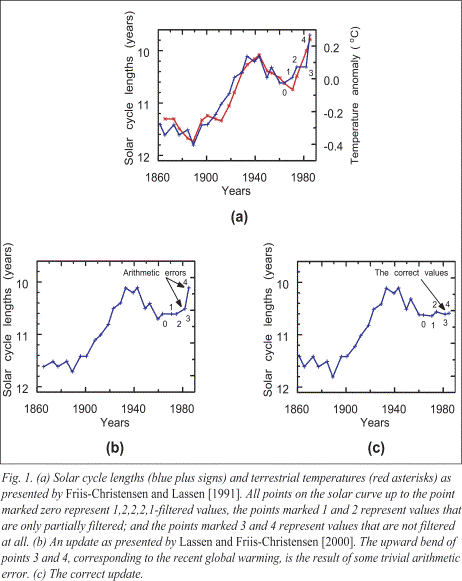
… that the apparent strong correlations displayed on these graphs have been obtained by incorrect handling of the physical data. The graphs are still widely referred to in the literature, and their misleading character has not yet been generally recognized. Below, we show Damon and Laut’s comparison of (a) the original Friis-Christensen and Lassen data from 1991 which was used in the documentary, (b) an updated version of the solar data from 2000, and (c) the corrected data. As a result of the correction, the apparent correlation between sunspot cycle length and terrestrial temperature disappears after 1960. This was not identified by the film makers. In 2000, Lassen and Friis-Christensen replied to an earlier paper co-authored by Laut, and defended their earlier findings, reiterating that they considered the correlation to have been significant between 1570 and 1970, and making clear that this did not exclude any other climate forcing agents, “including the effect of man-made greenhouse gases, in particular, after 1970.” (http://tinyurl.com/39hka9). Thus Friis-Christensen and Lassen have themselves specifically stated that the correlation only exists up to 1970. Continued … |
[Bookmarks on this page:
Click the following link to go to that bookmark. You can then copy and paste
the bookmark’s url from your address bar, and send it to someone as a link
straight to that bookmark:
Figure 1 from Damon and Laut 2004]
|
|
||
