|
|
|
Extracts from Ofcom Complaint, by Category Misrepresentation of
|
Table of Contents:
Click any of the following links to go to that bookmark. You can then return the top of the page (e.g. by pressing <Alt> + <Left Arrow> or <Ctrl> + <Home>), and select a different section, thus allowing you to use this list as a Table of Contents:
Comment 60: Sunspot activity since 1540 / Two graph comparison
Key to colour-coded commentary text
Bright red text: Actual falsification of data, and/or misrepresentation of the views of a contributor to the programme
Dark red text: Narration, or on-screen graphics, or an accumulation of consecutive interviewee statements that taken together amount to narration; which are either factually inaccurate, or apparently intentionally misleading, or are an attempt to give the impression that a contentious opinion is a fact.
Blue text: Interviewee is either factually inaccurate, apparently intentionally misleading, or expresses an opinion as if it were a fact without context being provided to make it clear that it’s an opinion.
[Although Dr Friis-Christensen has stated publicly that his views were misrepresented in the film and that one of his graphs appears to have been falsified, the complainants did not ask him to authorise our complaint; and as a result, this section was considered by the Standards Division of Ofcom, and not by the Fairness Division.]
|
[Narrator] |
What they found was an incredibly close correlation between what the sun was doing and changes in temperature on earth. Solar activity, they found, rose sharply to 1940, fell back for four decades until the 1970s, and then rose again after that. |
|
[Dr Eigil Friis-Christensen, Director, Danish National Space Centre] |
When we saw this correlation between temperature and solar activity or sunspot cyclings, then people said to us: “okay it can be just a coincidence.” So how can we prove that it’s not just a coincidence? Well one obvious thing is to have a longer time series, or a different time series. Then we went back in time. |
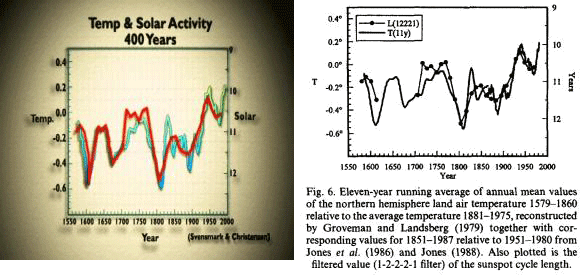
[Comment 60: Cut to a graph comparing temperature and solar cycle length since 1540, which is (mostly) taken from Friis-Christensen and Lassen, J . Atmos. Terr. Phys. 57, 835 (1995). As with their 1991 paper, the documentary fails to mention that the paper’s results have been strongly disputed in the scientific literature (see Peter Laut, 2003, http://tinyurl.com/2ule4h, PDF, and Damon and Laut, 2004, http://tinyurl.com/2cwntm, PDF).
But much more importantly, the original graph has been falsified by the film makers. The original Lassen and Friis-Christensen graph shows a gap in the sunspot cycle length curve (line dotted with circles) for the period 1600 to 1700. This is because this period was the Maunder Minimum (http://tinyurl.com/p479h), a period when there were few sunspots. It’s not possible to measure the sunspot cycle length when there are no sunspots. The documentary makers presented a graph, however, where this gap had been filled with the temperature data, giving the impression of perfect correlation during this period. Here are the two graphs side by side:
On April 27, 2007 Friis-Christensen issued a joint statement with one of the lead authors of this complaint Nathan Rive (see http://tinyurl.com/yvmatf), which states:
We have concerns regarding the use of a graph featured in the documentary titled ‘Temp & Solar Activity 400 Years’. Firstly, we have reason to believe that parts of the graph were made up of fabricated data that were presented as genuine. The inclusion of the artificial data is both misleading and pointless. Secondly, although the narrator commentary during the presentation of the graph is consistent with the conclusions of the paper from which the figure originates, it incorrectly rules out a contribution by anthropogenic greenhouse gasses to 20th century global warming.
Rive and Friis-Christensen go on to state:
The audience is told that the L+FC results demonstrate (a) the sun drove temperature changes over the past 400 years, and (b) no other agents were involved in changing the climate in that time. This is an overstatement that is not supported by the graph, interview statements by Friis-Christensen in the program, nor any related scientific literature. Although solar variations seem to be a major cause of climate variations on centennial and millennial time scales in the pre-industrial era (see for example Bond et al.,2001 [Science, 294: 2130-6]), there are certainly other natural sources of climate change. For the industrialised period, the L+FC (and other) results do not exclude an effect from man-made greenhouse gases.
Thus Friis-Christensen has stated quite clearly and publicly that not only was his published data falsified by the film-maker, but that his views were knowingly and fundamentally misrepresented by the film.]
(In breach of the 2003 Communications Act Section 265, Ofcom 5.7, 7.2, 7.3, 7.6, 7.9)
