|
|
Extracts from Ofcom Complaint, by Category: Falsification/Manipulation1. Falsification/Manipulation of Graphs |
|
|
|
|
|
Using the “significantly” warmer Holocene Maximum period to suggest that we should not be concerned with warming also neglects the fact that the ecosystems and economies of today are not the same as those of 7–8000 years ago: the global population is much larger and societies live in built-up environments. For an assessment of how future warming is likely to impact economies and ecosystems during the 21st century, see the IPCC Third Assessment Report on Impacts, Adaptation and Vulnerability at http://tinyurl.com/hu7dr.] (In breach of the 2003 Communications Act Section 265, Ofcom 5.4, 5.5, 5.7, 5.11, 5.12)
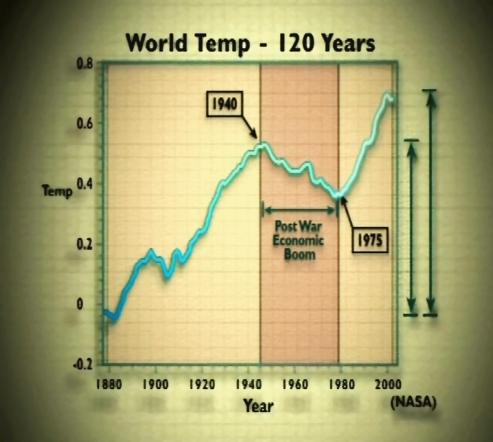
[Comment 42: At this point, the original transmission (on Channel 4, 8 March, 2007) showed the following graph of world temperatures, which it attributed to “NASA”, with a time axis running from around 1875 to 2005, and two arrows to illustrate the claim that “most of the rise in temperature [since the mid-19th century] occurred before 1940”: An investigation by The Independent newspaper (see http://tinyurl.com/2wrm7u) revealed that the graph used by the Channel 4 programme was taken directly from a non-peer-reviewed paper by Arthur Robinson and Zachary Robinson of the Oregon Institute of Science and Medicine (see page 154 [of the full complaint]), with co-authors Sallie Baliunas and Dr Willie Soon (see page 138 [of the full complaint]) of the George C. Marshall Institute (see page 149 [of the full complaint]). Continued … |
[Bookmarks on this page:
Click any of the following links to go to that bookmark. You can then copy and paste
the bookmark’s url from your address bar, and send it to someone as a link
straight to that bookmark:
Comment 42: 20th Century Cooling /
Graph from the film: World Temp 120 Years]
|
|
||
