|
|
Extracts from Ofcom Complaint, by Category: Falsification/Manipulation1. Falsification/Manipulation of Graphs |
|
|
|
|
|
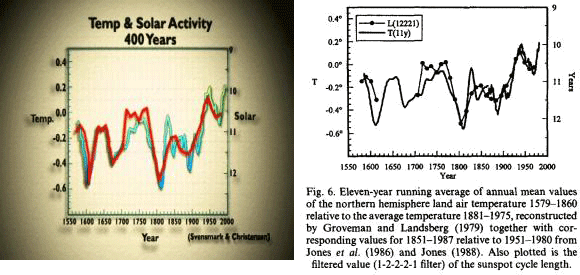
But much more importantly, the original graph has been falsified by the film makers. The original Lassen and Friis-Christensen graph shows a gap in the sunspot cycle length curve (line dotted with circles) for the period 1600 to 1700. This is because this period was the Maunder Minimum (http://tinyurl.com/p479h), a period when there were few sunspots. It’s not possible to measure the sunspot cycle length when there are no sunspots. The documentary makers presented a graph, however, where this gap had been filled with the temperature data, giving the impression of perfect correlation during this period. Here are the two graphs side by side: On April 27, 2007 Friis-Christensen issued a joint statement with one of the lead authors of this complaint Nathan Rive (see http://tinyurl.com/yvmatf), which states: We have concerns regarding the use of a graph featured in the documentary titled ‘Temp & Solar Activity 400 Years’. Firstly, we have reason to believe that parts of the graph were made up of fabricated data that were presented as genuine. The inclusion of the artificial data is both misleading and pointless. Secondly, although the narrator commentary during the presentation of the graph is consistent with the conclusions of the paper from which the figure originates, it incorrectly rules out a contribution by anthropogenic greenhouse gasses to 20th century global warming. Rive and Friis-Christensen go on to state: The audience is told that the L+FC results demonstrate (a) the sun drove temperature changes over the past 400 years, and (b) no other agents were involved in changing the climate in that time. This is an overstatement that is not supported by the graph, interview statements by Friis-Christensen in the program, nor any related scientific literature. Although solar variations seem to be a major cause of climate variations on centennial and millennial time scales in the pre-industrial era (see for example Bond et al.,2001 [Science, 294: 2130-6]), there are certainly other natural sources of climate change. For the industrialised period, the L+FC (and other) results do not exclude an effect from man-made greenhouse gases. Continued … |
[Bookmarks on this page:
Click the following link to go to that bookmark. You can then copy and paste
the bookmark’s url from your address bar, and send it to someone as a link
straight to that bookmark:
Two graph comparison]
|
|
||
